
Algae Biofuel: Growing Green Goop
Want to try it? It's live on the New Mexico Museum of History & Science's website.
Learn about the research and production of algae-based bio-diesel fuel in New Mexico with this educational game, created for the New Mexico Museum of Natural History & Science and funded by a New Mexico EPSCoR grant.
For this project, I was hired to take an existing program developed a few years ago by New Mexico Highlands University students and upgrade it to work as a single-page web application. I wanted it to work on all devices, because educators with New Mexico EPSCoR plan to take the program on the road and use it to educate kids in rural areas of the state. Hence, the "Bio-Al" character was developed by the graphic designer at NMMNH&S to appeal to younger audiences.
I always love using Vue to create JavaScript interactives because it makes it so easy and delightful. The aspect of the game that I'm most proud of is the interactive graph. I used Vue's wonderful data-binding capabilities to make the graph morph in real time with response to user input.
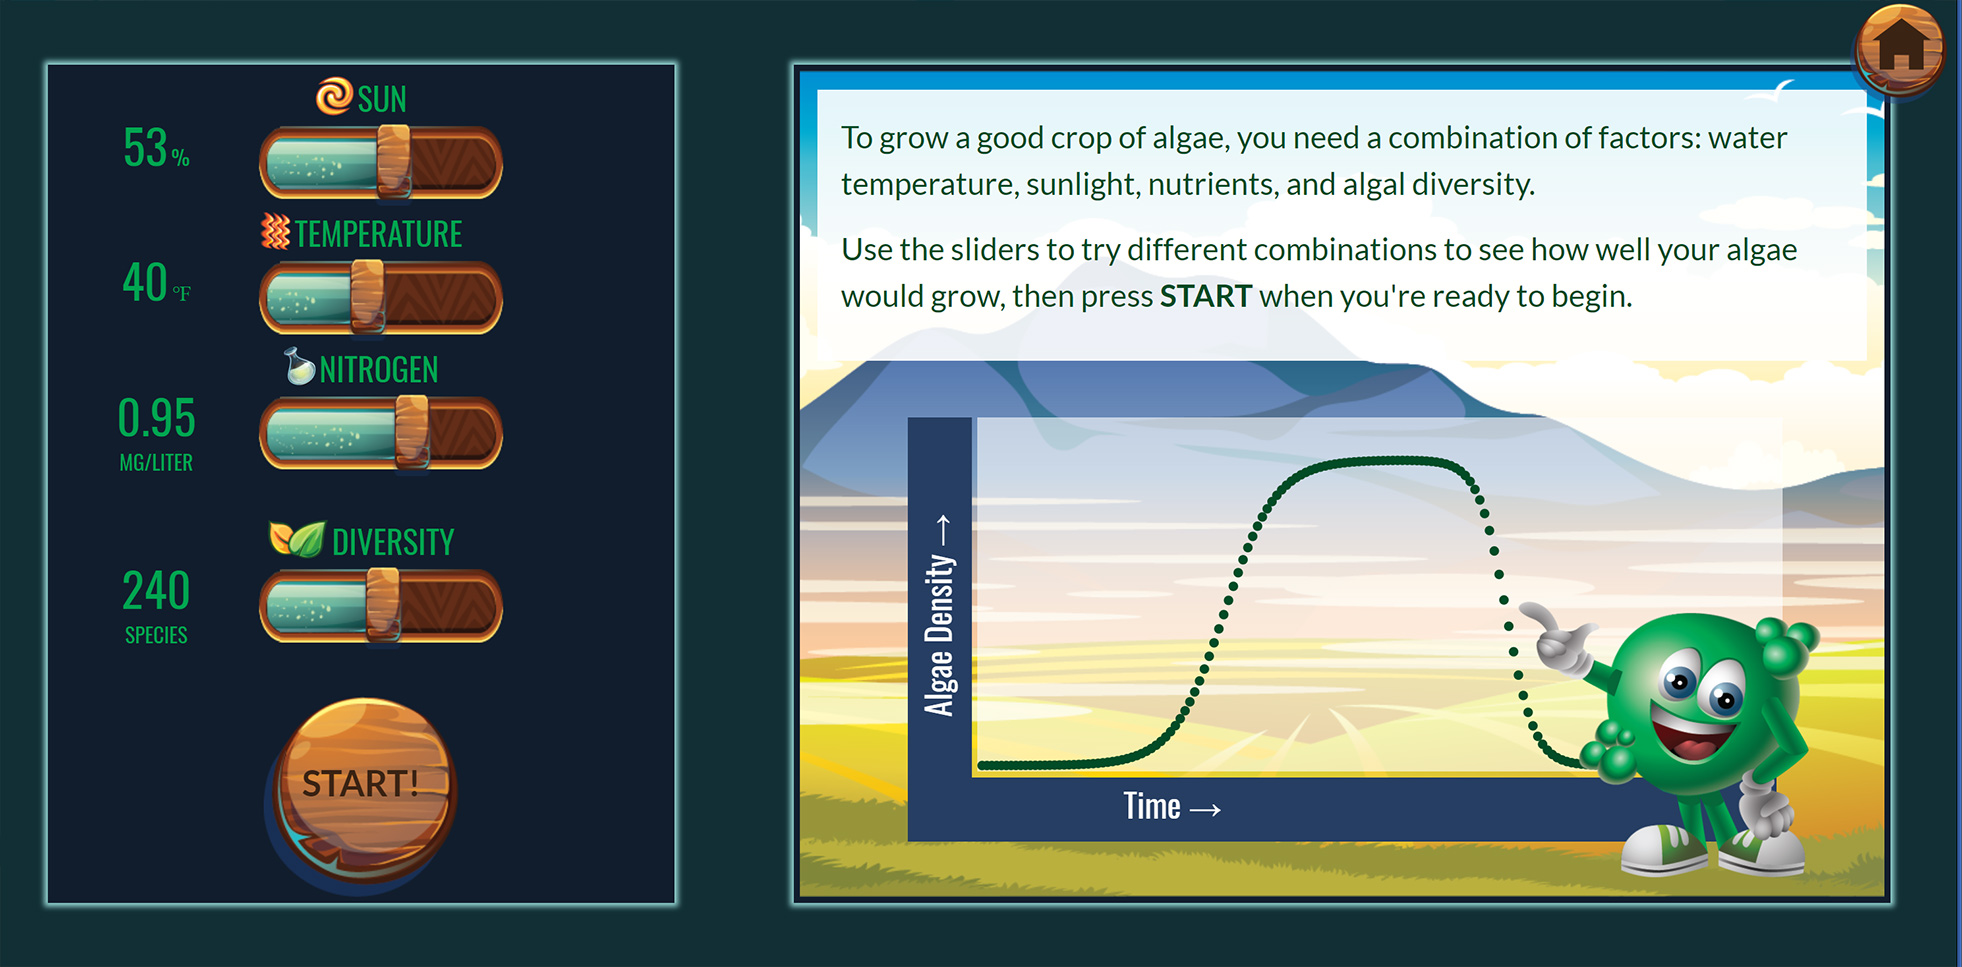
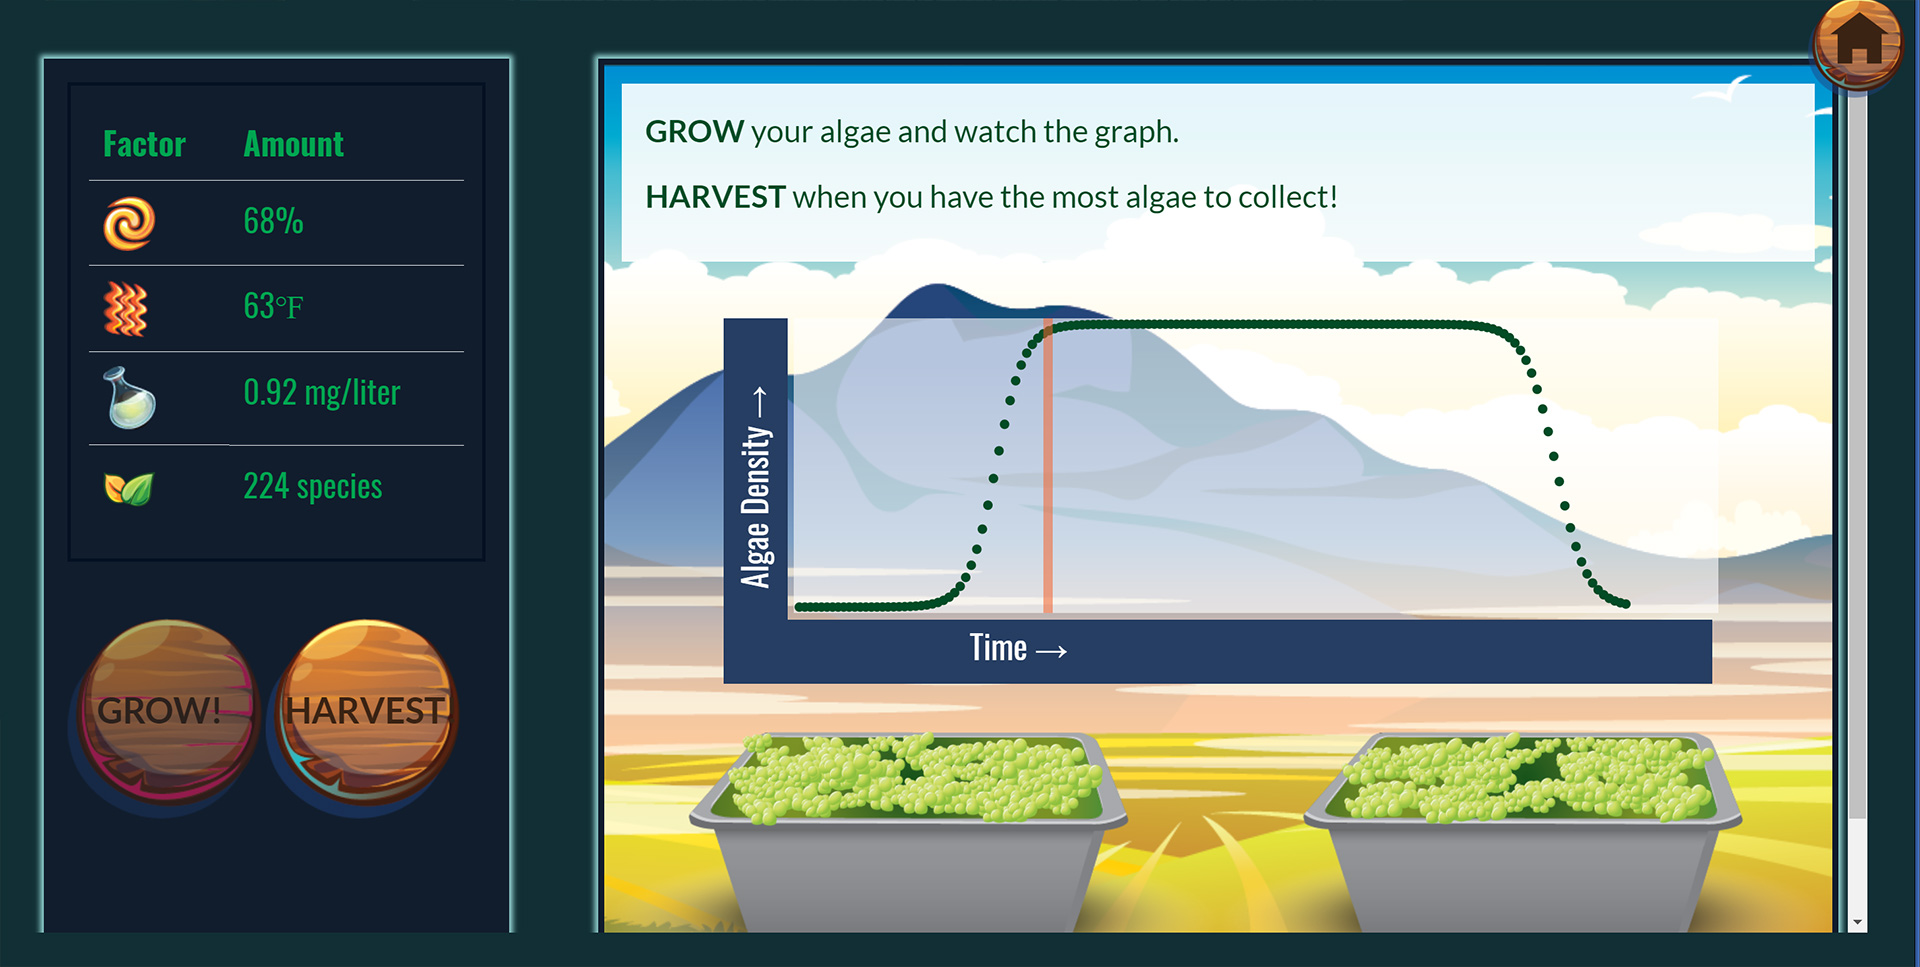
The interactive graph with controls on the left.
I used a logistic function with variations based on all four parameters to model the growth and eventual crashing of the algae crop. The data-binding function in Vue takes an x-value for time and then spits the corresponding y value for the percent population at that time. I use these x and y values to plot a set of SVG ellipses on the graph. Thanks to Vue's speedy responsivity, users don't see any lag between their inputs changing and the population model changing. The code for the different parts of the function is a little too long to share, but here are the more Vue-specific bits.
    <svg class="graph-svg" :height="svgHeight">
        <circle r="4" fill="#014c26"
        v-for="pt in points"
        :cx="getPointX(pt)"
        :cy="getPointY(pt)"/>
        <!-- Rect is used as the timer during the game -->
        <rect v-if="time >= 0" :height="svgHeight"
            width="8" style="fill: rgb(242, 100, 46); opacity:0.55" :x="scrubX" y="0"/>
    </svg>
methods : {
getPointX : function (pt) {
var percent = pt / this.points;
return percent * this.svgWidth;
},
getPointY : function (pt) {
var time = pt / this.points * this.maxTime;
var population = this.getPopulation(time);
// Add a little buffer so it doesn't get cut off at the top or bottom
return 5 + ( 1- population) * (this.svgHeight - 10);
},
// The population as a function of time
getPopulation : function (t) {
var upSlope = 0.5 * this.maxPop / (0.5 + Math.pow(Math.E, -1*this.sHalf*(t - this.tHalf)));
var downSlope = 0.5 * this.maxPop / (0.5 + Math.pow(Math.E, this.sCrash*(t - this.tCrash)));
var population = upSlope + downSlope - this.maxPop;
// Don't want to return less than zero because that doesn't make any sense.
return Math.max(population, 0);
}
}I use the same graph during the game to calculate the score and animate the algae growing. The output of the graph both determines what color you see in the tubs and how many algae bits are there. It was really fun to do.
Some of the grant money went to making videos about the algae research at different institutions in the state. They're pretty fun, and they are also featured in another section of this same program.
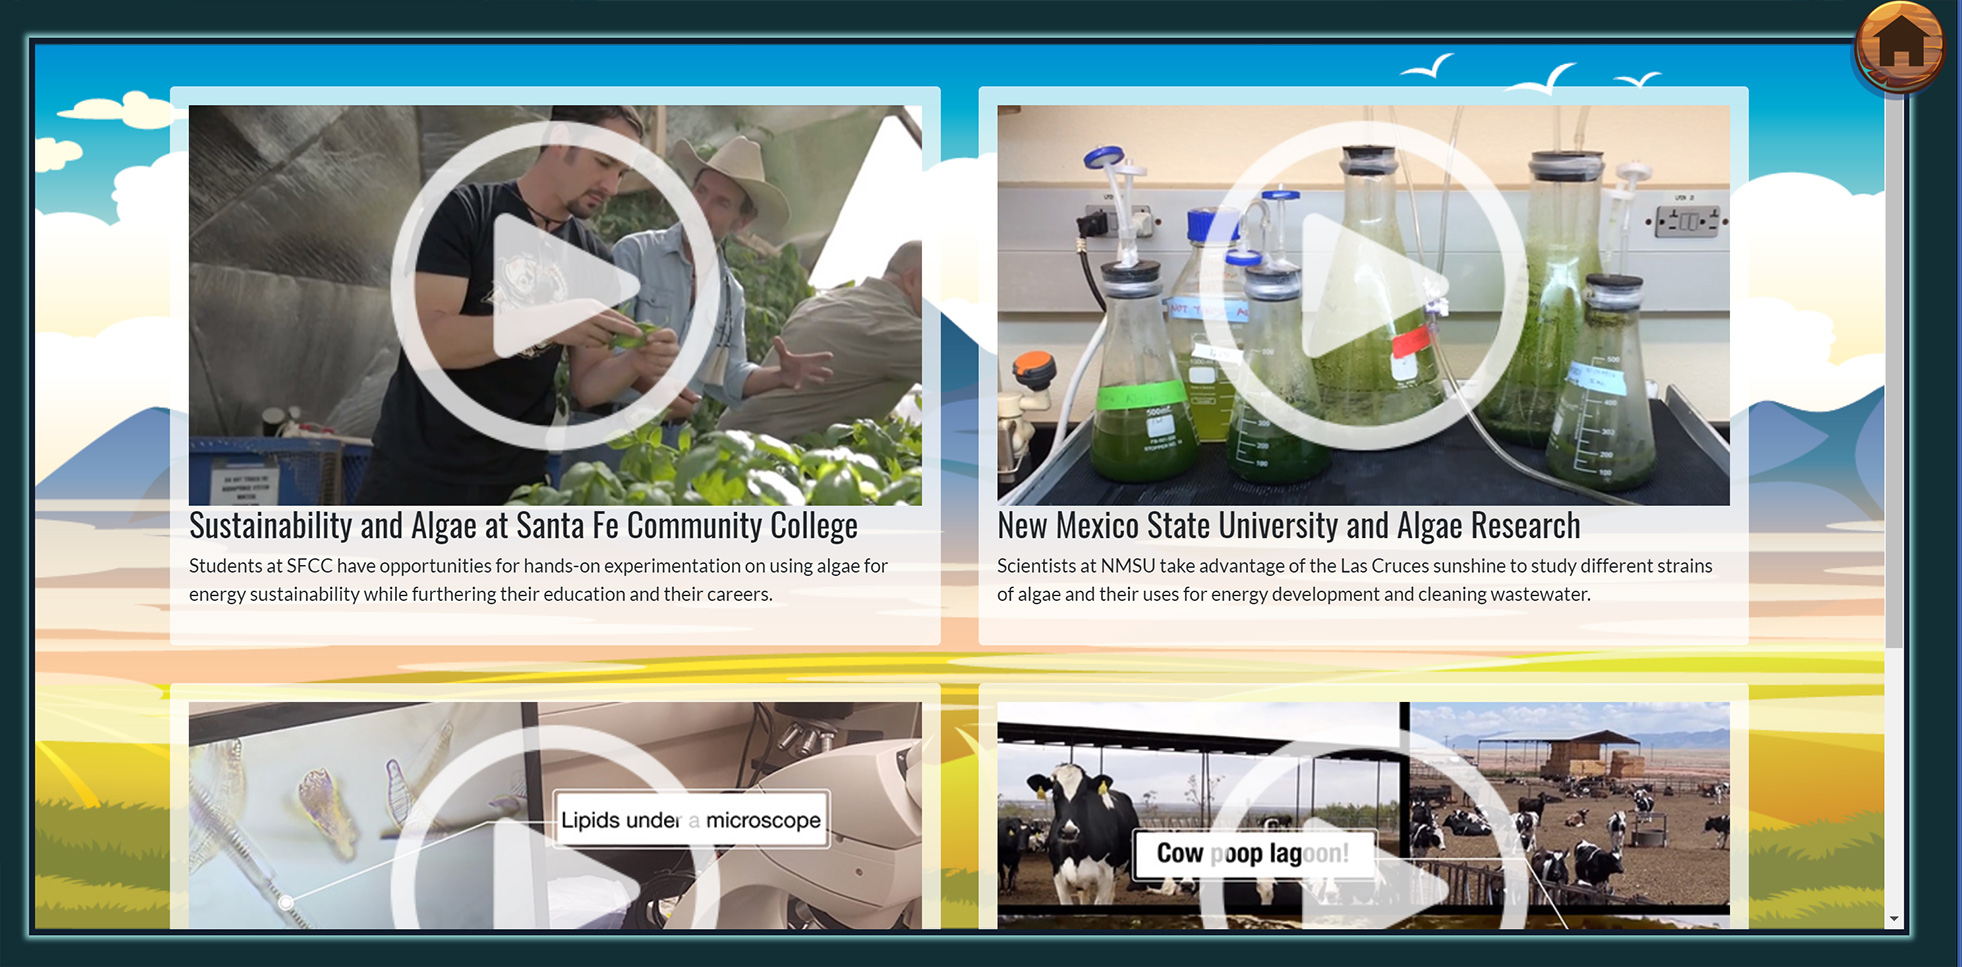
The video browser
To play the videos, I'm using Vimeo's API and just binding the source to the video idea that's saved with the program. Simple and effective.